Infographics is a relatively new word. It's used to describe visuals that combine data and images to illustrate a complicated idea. The intent is to make complex data easy to understand by turning it into a visual presentation. You'll have noticed them in use everywhere, but most prevalently in data-heavy news shows and articles, research documents, and shared on social media.
Being a graphic designer, of course I've been creating infographics for a long time. I even did a presentation on infographics last year, called "Infographics 411", where I delved into the effectiveness of infographics and what it takes to create one for your business. Click here to view the video presentation.
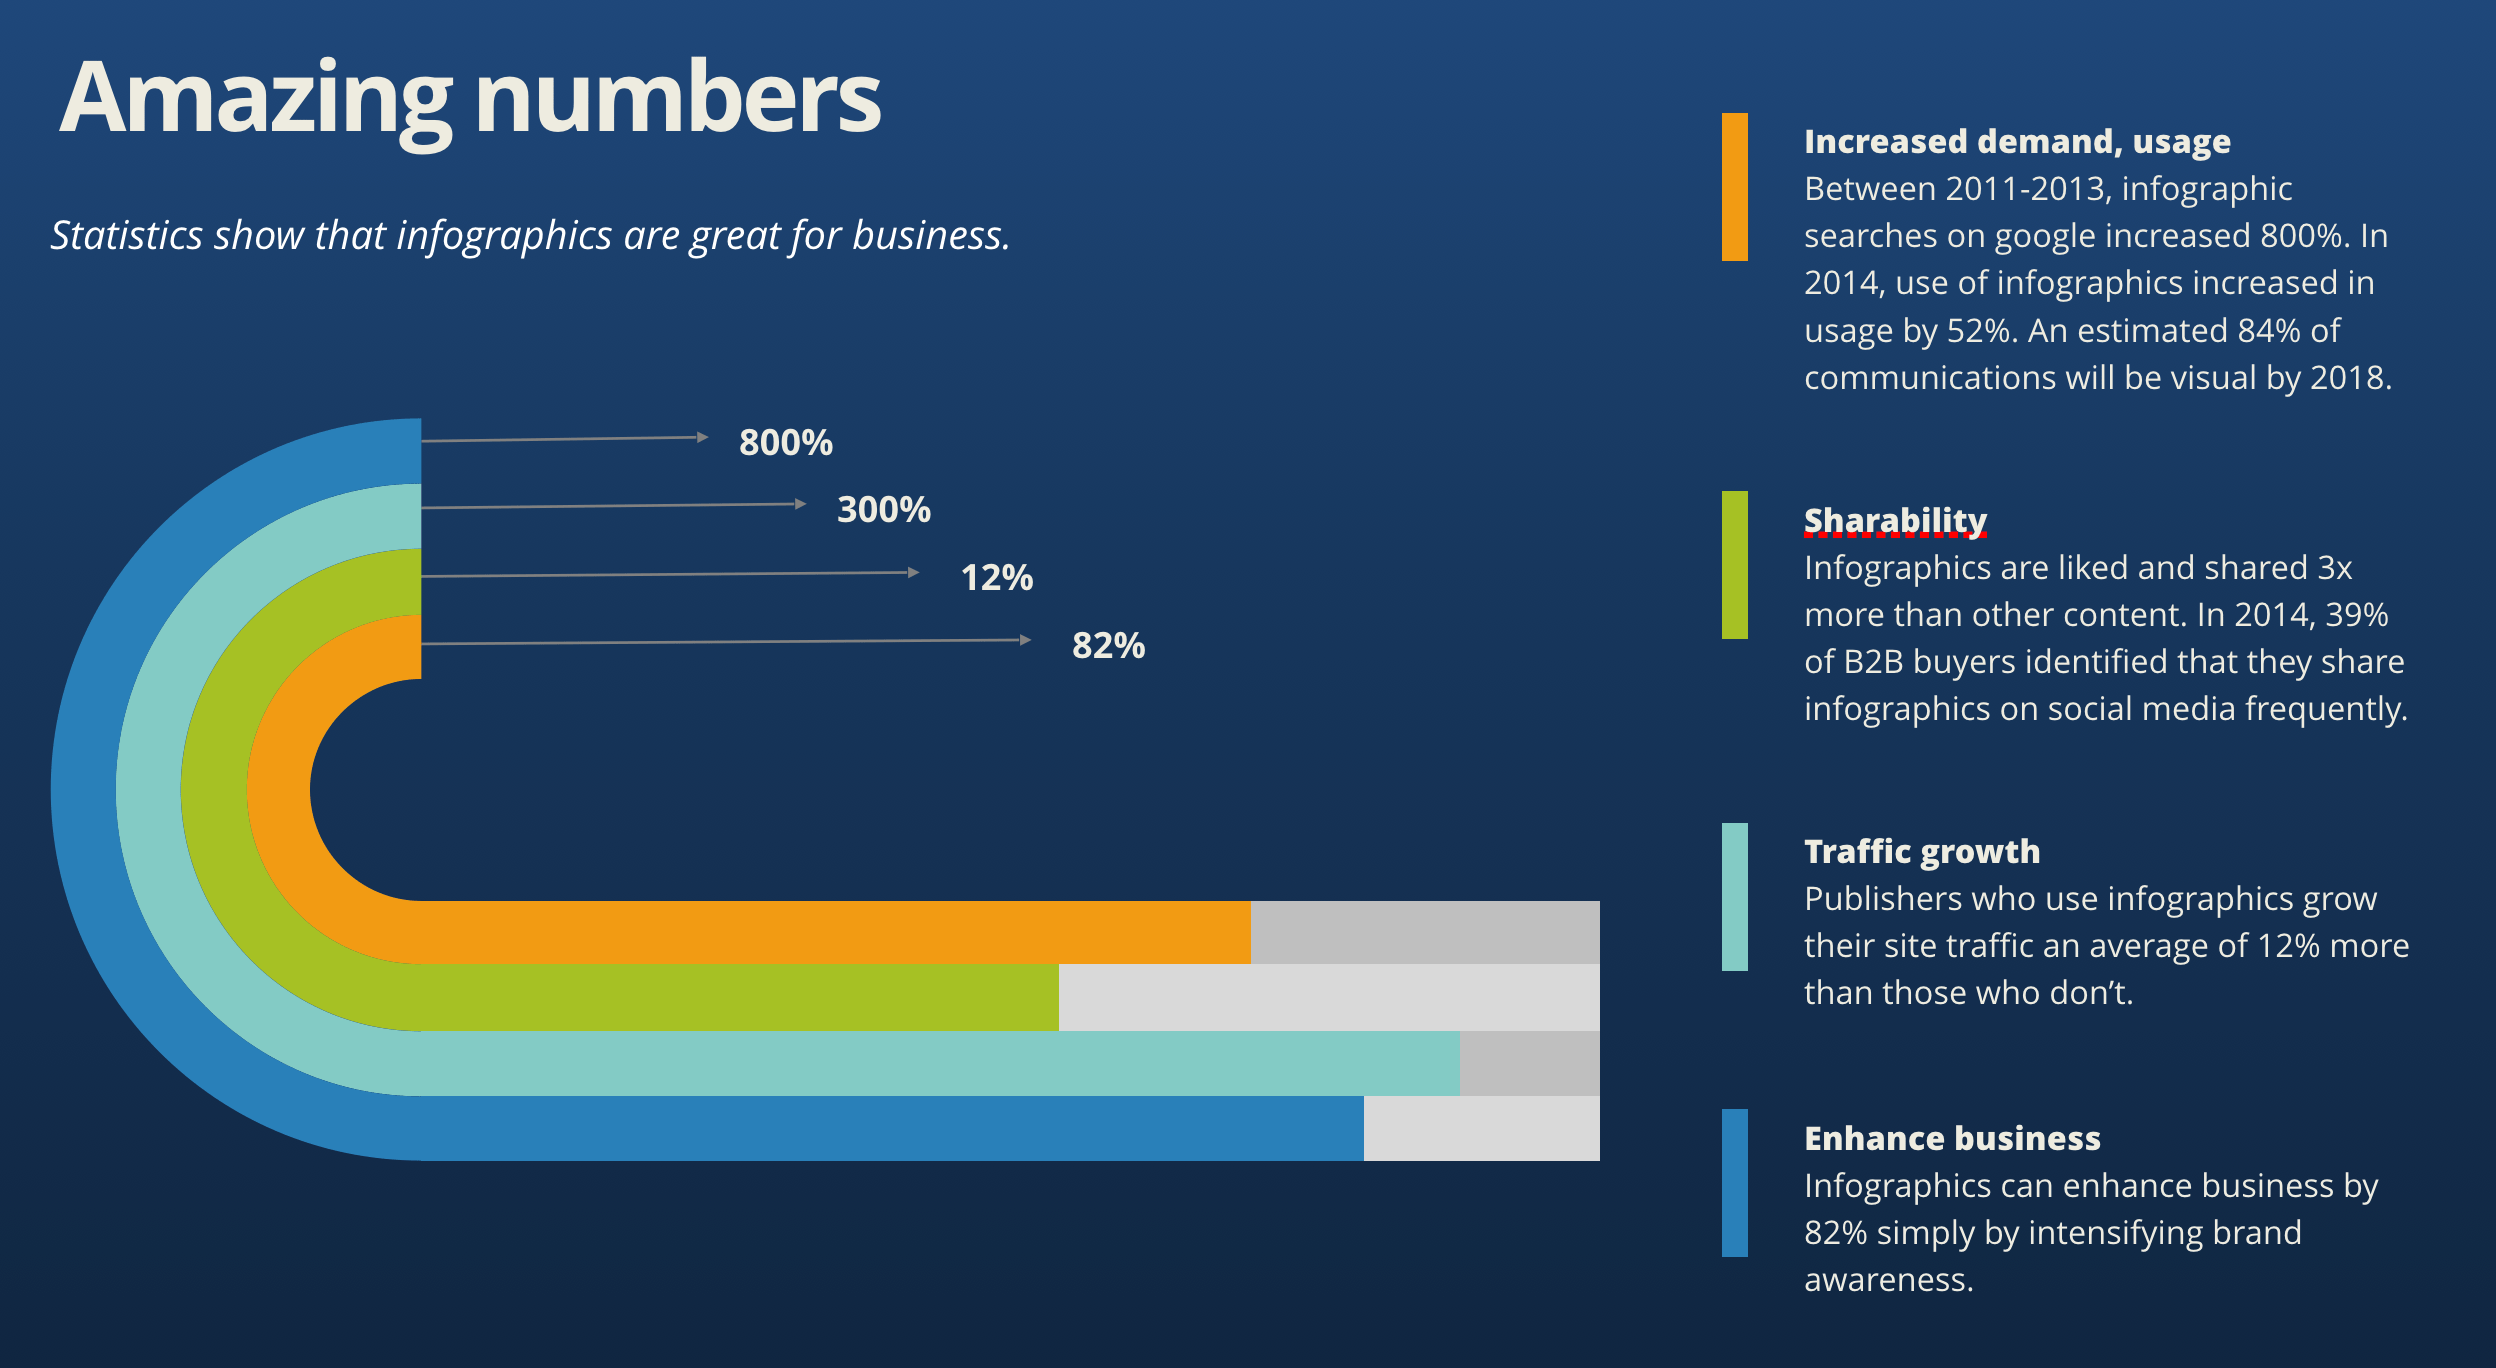
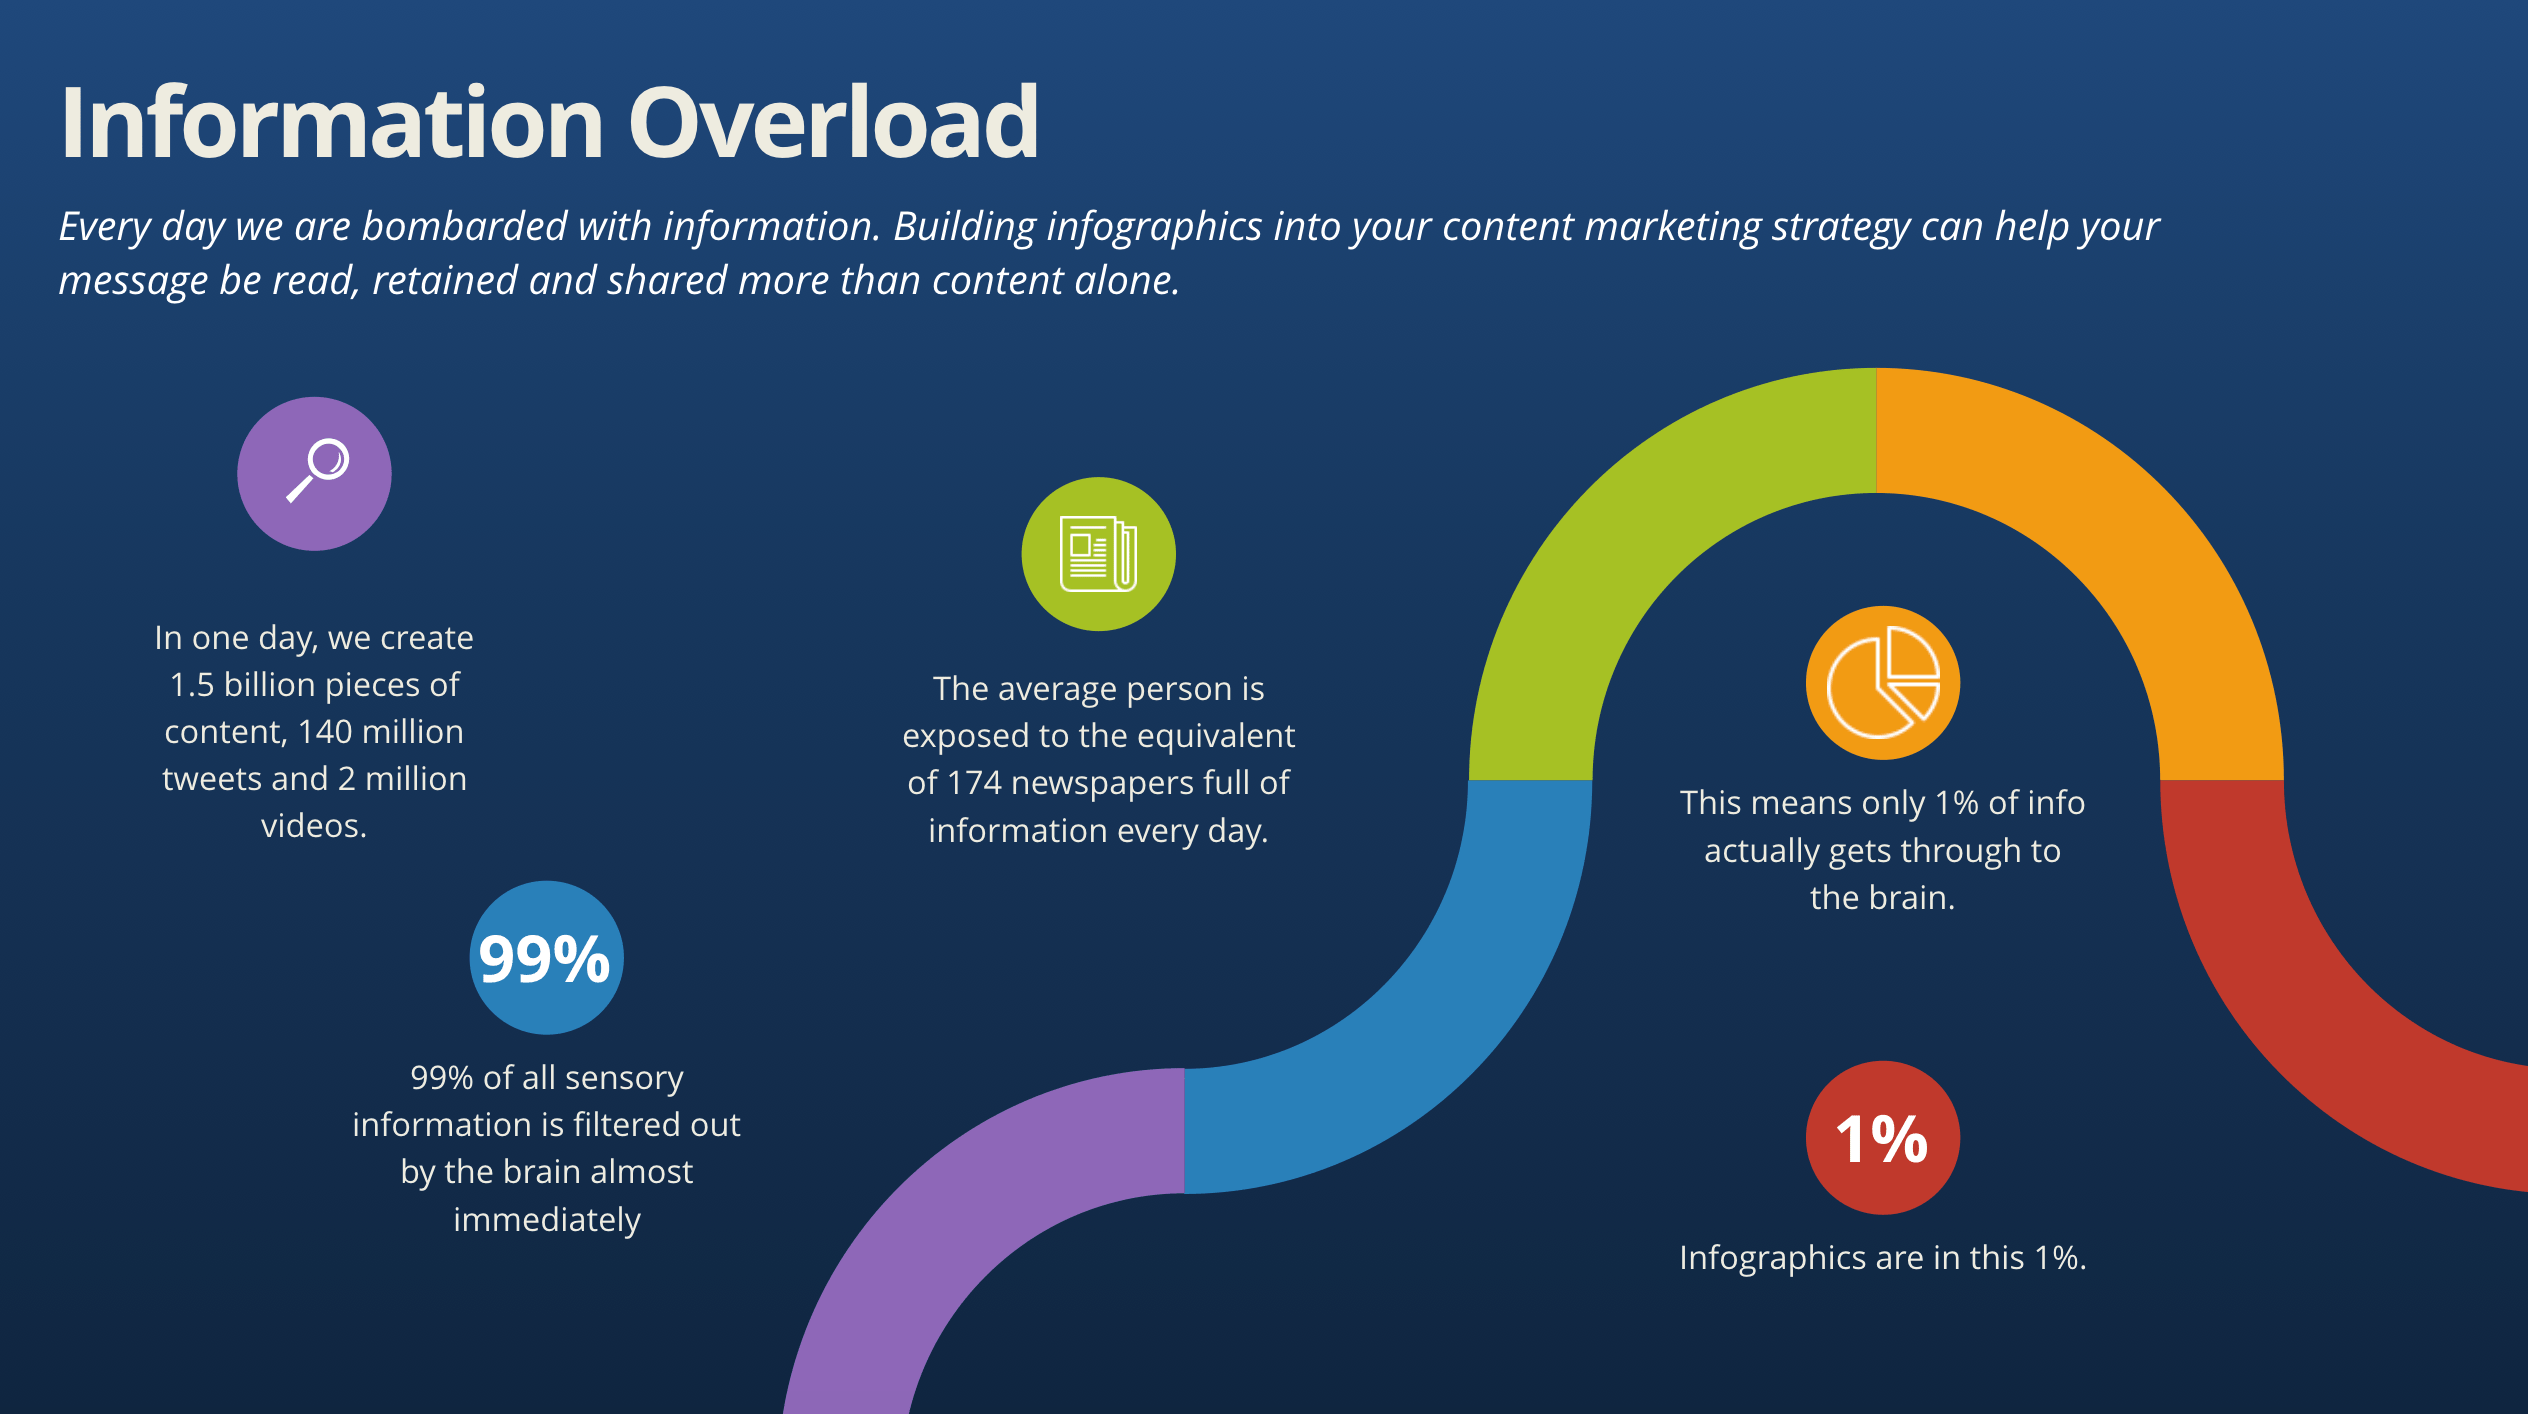
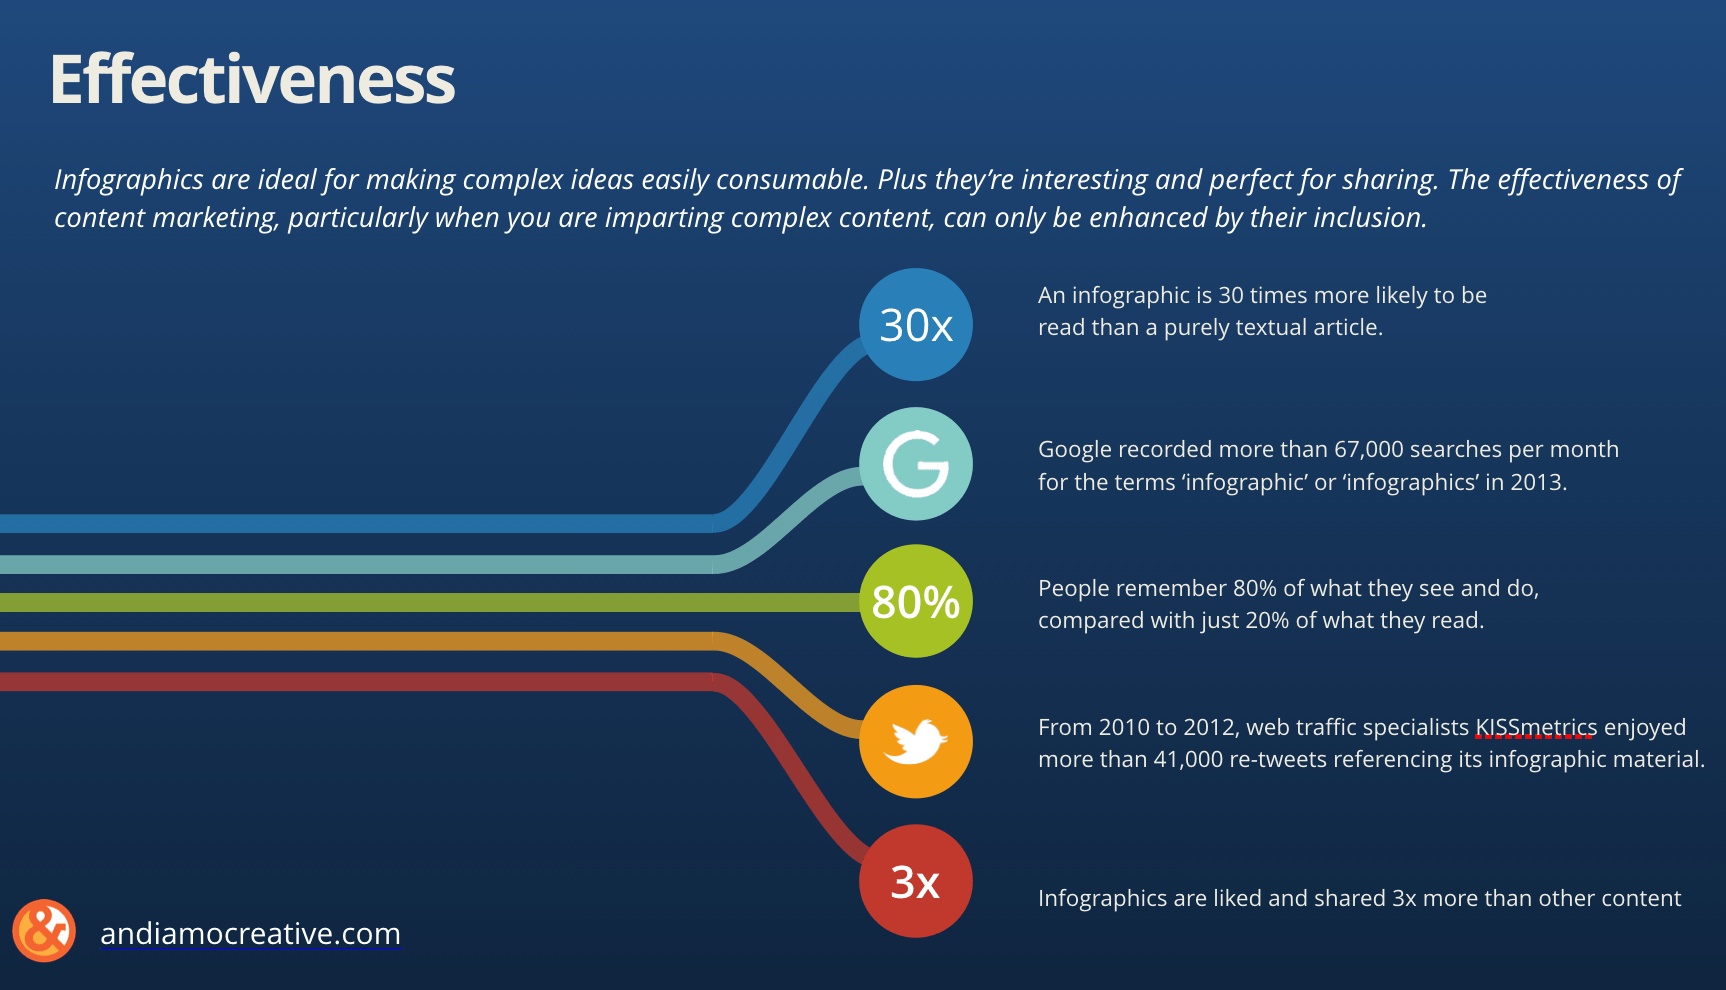
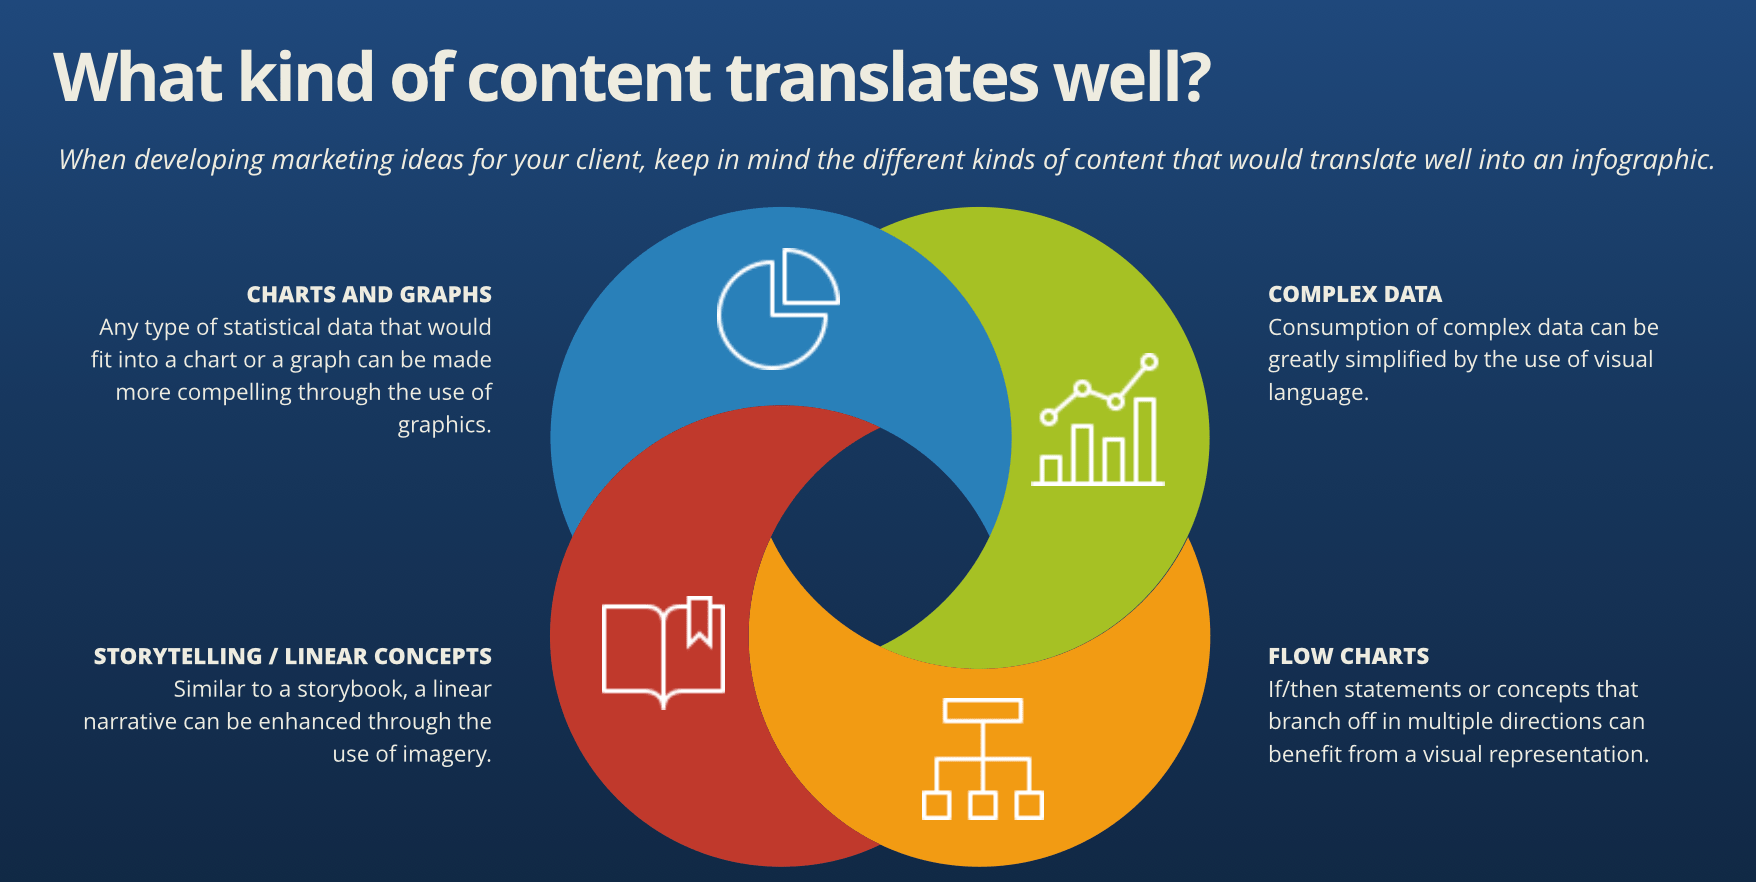
Here are a few key slides from the presentation, Infographics 411:

Infographics are great fun for me. I get to combine some of my favorite parts of my job - illustration, organization and typography. Plus if done well and used correctly, they can be incredibly effective in relaying a message in an interesting way - which increases the likelihood of being shared on social media - and gets my client's brand noticed. All good things!